Add page to bookmarks

BMI calculator

BMI with comparisons

Enter your current weight in kilograms.

Enter your current height in centimeters.

Enter your current age in years.

Choose your gender.

Choose your level of physical activity.

Results:
A History of Computing:
    You will also be interested in
    If you have comments, errors, or suggestions for improving this page, please send us via the form below.
    Your opinion is very important to us and will help us improve this page for all users. Thank you for your help. We hear everyone and will respond 100%!

    Table of contents

    Our health and well-being often depend on important indicators such as body mass index (BMI). Here is an easy-to-use and accurate online BMI calculator designed with the user in mind. This tool helps you to quickly and easily determine your BMI and understand whether your weight is within the normal range or if there are abnormalities.

    The ease of use of our calculator is that you only need to enter your basic body parameters: weight in kilograms, height in centimeters, age and gender. Additionally, taking into account your level of physical activity, the calculator adapts the results, making them as accurate and personalized as possible.

    A special feature of this calculator is its ability to not only give you your current BMI, but also compare it to your ideal BMI, offering recommendations to improve your physical condition. Thanks to this, the user can not only find out their BMI, but also get valuable advice on their health and well-being.

    The convenient calculation history function allows you to save previous results, making the process of monitoring weight and BMI changes especially convenient and efficient. The Clear History button makes it easy to manage your data and helps you focus on your current health improvement goals.

    Using our BMI calculator is the first step in taking a conscious approach to your health and well-being. This tool is designed to help you manage your weight easily and effectively, and to encourage you to achieve and maintain an optimal level of fitness.

    Our online BMI calculator is your trusted assistant on your journey to a healthy lifestyle. Try it now to take the first step towards improving your health and well-being!

    To use the BMI (body mass index) calculator and recommendations for better health, it's important to fill out the form correctly. Here are detailed instructions to help you do this:

    Weight (kg)

    This field is for entering your current weight in kilograms. Enter your exact weight, using decimals for a more accurate calculation if necessary. For example, if your weight is 70.5 kilograms, enter "70.5".

    Height (cm)

    Here you must enter your height in centimeters. It is important to enter your full height without rounding. If your height is 172.3 centimeters, enter "172".

    Age

    Enter your current age in full years. This parameter is used to adjust the BMI calculation because weight changes with age. For example, if you are 30 years old, enter "30".

    Paul

    Select your gender from the options offered ("Male" or "Female"). This option also affects the calculation of BMI, as men and women have different body weight distributions.

    Activity level

    Choose your level of daily physical activity from the options provided. This will help tailor the recommendations to your lifestyle. Options include "Minimal activity", "Light activity", "Moderate activity", "Active lifestyle" and "Extreme activity". Rate your activity based on your normal daily routine.

    Calculating BMI

    After filling in all the fields, click the "Calculate BMI" button. You will be presented with the results of the calculation, including your BMI and its interpretation, comparison with your ideal BMI, and personalized recommendations.

    Important points:

    • Data Accuracy: the more accurately you enter your data, the more accurate the calculation will be.
    • Data Validation: make sure that all figures are entered correctly, especially weight and height.
    • Confidentiality: The data entered is processed directly in your browser and is not sent anywhere, ensuring your privacy.

    Пользуясь этим калькулятором, вы можете получить представление о своем ИМТ и рекомендации для поддержания или достижения здорового веса. Однако помните, что он не заменяет профессиональную медицинскую консультацию.

    The BMI calculator is a real boon for those who care about their health and strive for a balanced lifestyle. This tool will be your trusted assistant on your health journey, offering key information to make informed decisions about your diet, physical activity and overall well-being. Here's who will especially benefit from using it:

    For those striving for health: If your goal is to maintain an ideal weight and an active lifestyle, a BMI calculator will reveal how much your current weight meets health standards, taking into account your height and age. It will be the starting point for determining your path to achieving your ideal fitness.

    For weight watchers: The BMI calculator is your personal analyzer that will help you track how changes in weight affect your fitness. This will allow you to make timely adjustments to your diet and activity level to keep your weight under control.

    For those new to health care: If you are just starting your journey to a healthy lifestyle, the calculator will offer you basic information about your physical condition and give you recommendations on how to move step by step towards better health and shape.

    For active athletes: For athletes striving for specific physical performance, a BMI calculator can help them assess whether their weight and condition are in line with their goals, and what needs to be adjusted in the training process.

    For those facing health risks: For people who are prone to diseases related to excess weight, such as diabetes or cardiovascular disease, a BMI calculator will be a tool to monitor health conditions and correct them.

    For medical professionals: Doctors and nutritionists can use the calculator to assess their patients, providing personalized recommendations based on it to achieve better health outcomes.

    In general, the BMI calculator is a universal tool that benefits everyone who strives for a healthy and active lifestyle. It provides not only figures and indicators, but also gives practical advice for maintaining health and achieving physical harmony.

    Let's look at a few examples of using a BMI calculator for a variety of tasks related to maintaining and improving health.

    Estimating BMI for health maintenance

    Problem Statement: Anna wants to know her BMI to see if her weight is within the normal range.

    Solution Steps:

    1. Anna enters her data: weight 65 kg, height 170 cm, age 28 years, gender female, activity level - medium activity.
    2. She clicks the "Calculate BMI" button.

    Calculation results: Anna's BMI is 22.5, which falls into the Normal Weight category.

    Application to practice: With this data, Anna can continue to follow her current lifestyle as her weight is in the optimal range for health.

    Weight loss planning

    Problem Statement: Michael has decided to lose weight and wants to know his BMI in order to create a nutrition and exercise plan.

    Solution Steps:

    1. Mikhail enters his data: weight 90 kg, height 175 cm, age 34 years, male gender, activity level - minimal activity.
    2. He clicks the "Calculate BMI" button.

    Calculation results: Michael's BMI is 29.4, indicating that he is overweight.

    Application to practice: With this information, Michael can develop a customized nutrition plan with a dietitian and increase physical activity to gradually lose weight and achieve a normal BMI.

    Maintaining health in old age

    Problem Statement: Elena, 65, wants to check her BMI to make sure her weight stays in a healthy range as she ages.

    Solution Steps:

    1. Elena enters her data: weight 70 kg, height 160 cm, age 65, gender female, activity level - light activity.
    2. She clicks the "Calculate BMI" button.

    Calculation results: Elena's BMI is 27.3, which indicates that she is overweight.

    Application to practice: After realizing that her weight is a little higher than normal, Elena can see her doctor for advice on adjusting her diet and increasing her activity, which is especially important for maintaining health in old age.

    Planning for weight gain

    Problem Statement: Igor, an athletic student, wants to increase his muscle mass and wants to know his BMI to determine a starting point.

    Solution Steps:

    1. Igor enters his data: weight 60 kg, height 182 cm, age 20 years, male gender, activity level - active lifestyle.
    2. He clicks the "Calculate BMI" button.

    Calculation results: Igor's BMI is 18.1, indicating that he is underweight.

    Application to practice: Knowing his BMI, Igor can consult a sports nutritionist for a high-protein, high-carbohydrate meal plan and a trainer to develop a training program to build muscle mass.

    These examples demonstrate how a BMI calculator can be used by people of different ages and activity levels to achieve and maintain health.

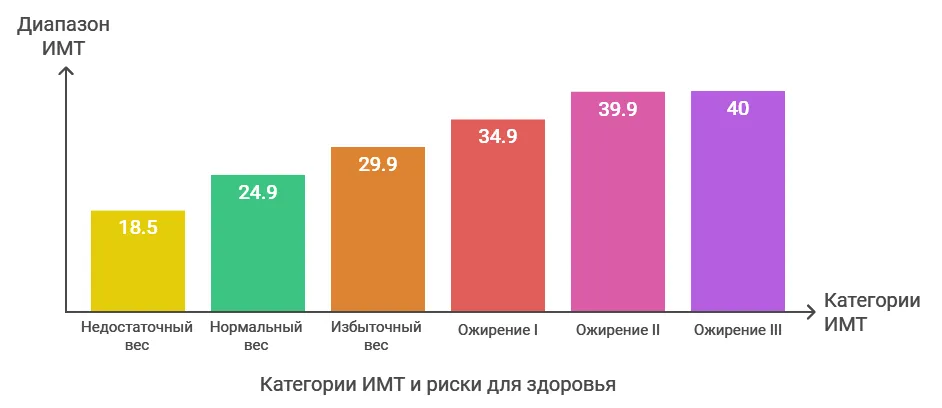
    For the convenience of the BMI calculator, I present a table that will serve as an information reference for interpreting the results of the calculation of body mass index (BMI) and recommendations for action depending on the value obtained.

    BMI (kg/m²)Weight categoryRecommendations and actions
    Less than 16Severe underweightIt is recommended to consult a doctor to identify the causes of underweight and develop a nutritional plan to normalize it.
    16 — 18.5UnderweightIt is important to increase the caloric content of the diet with an emphasis on healthy foods enriched with proteins, fats and carbohydrates.
    18.5 — 24.9Normal weightMaintain a balanced diet and regular exercise to maintain your health and well-being.
    25 — 29.9OverweightIt is recommended to revise the diet by reducing the number of calories consumed and increase physical activity.
    30 — 34.9Grade I obesityConsultation with a specialist (nutritionist, doctor) to develop an individualized weight loss program is necessary.
    35 — 39.9Grade II obesityIt is important to immediately begin comprehensive weight loss measures under medical supervision to avoid serious health problems.
    40 and upGrade III obesityRequires intensive medical intervention, possibly including drug therapy or surgical treatment.

    This table will help you with the BMI calculator to interpret your results and determine what steps you should take to improve or maintain your health. It is important to remember that any dietary or lifestyle changes should be made in consultation with qualified professionals.

    Please note that the BMI (Body Mass Index) calculator provided provides information for educational and informational purposes. The results obtained from this calculator do not constitute medical advice and cannot replace professional medical advice.

    The information provided by the calculator is based on the data you enter, such as weight, height, age, gender and activity level. However, every body is unique and results may vary depending on individual characteristics.

    Please consult a qualified medical professional or dietitian before making any decisions about changing your lifestyle based on the results obtained from this calculator. Keep in mind that only professional medical advice can provide you with a complete and accurate understanding of your health.

    By using the BMI calculator, you agree that you understand and accept the terms of this disclaimer. Your use of the calculator is at your own risk and the authors of the calculator are not responsible for any consequences resulting from its use.

    Body Mass Index, or BMI, is a key indicator that allows us to understand how our weight and height are in harmony. It's not just a number - it's an important step towards assessing our health and well-being. Let's look at how easy it is to calculate BMI and what these values tell us about us.

    To calculate BMI, a simple formula is used: your weight in kilograms divided by the square of your height in meters.

    For example, if your weight is 70 kg and your height is 1.75 meters, your BMI calculation will look like this:

    IMT = 70 / (1.75 * 1.75) ≈ 22.86

    What does the result tell us? BMI gives us an idea of what category our weight is in: ideal, underweight, overweight or obese. It allows us to assess the health risks associated with weight, including the likelihood of developing diabetes, heart disease and blood pressure problems.

    However, it's important to realize that BMI is only one of many factors in assessing health. It does not take into account muscle mass and body fat distribution, which can be critical for athletes and active fitness enthusiasts. Therefore, you should not rely on BMI alone to assess fitness and health. It is best to use it in combination with other indicators and, of course, do not forget about regular consultations with your doctor.

    Body Mass Index, or BMI, is key to understanding how your weight relates to your height, and plays a big role in assessing your overall health. This simple calculation can tell both men and women a lot about their physical condition. Let's take a look at what the BMI numbers mean according to World Health Organization (WHO) standards.

    If your BMI is less than 16, it indicates that your weight is well below normal levels, indicating a possible underweight. This can be a signal that the body lacks enough nutrients to function properly.

    A BMI of 16 to 18.5 also signals a lower than normal weight, which may indicate underweight. This is an indication that you should pay attention to your diet and lifestyle.

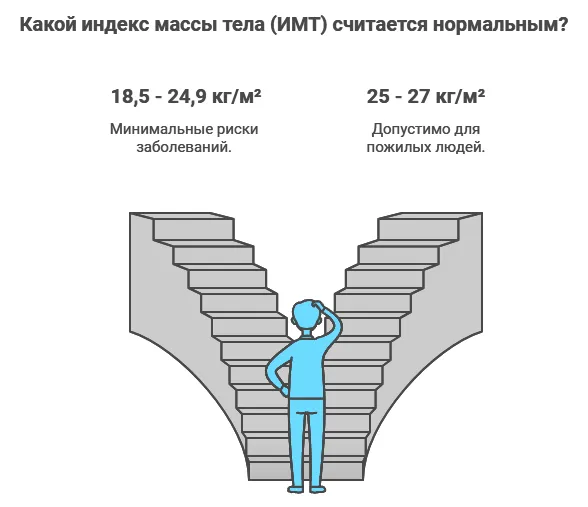
    When your BMI is between 18.5 and 25, this is considered a healthy range for most people, implying that your weight is in harmony with your height.

    A BMI between 25 and 30 indicates overweight, which can be a precursor to obesity and a signal to start working on your body.

    A BMI of 30 to 35 corresponds to the first degree of obesity, which can lead to various health problems and requires more careful attention to your lifestyle and diet.

    An index between 35 and 40 indicates second-degree obesity, which is a more serious call to action to improve your health.

    And a BMI of 40 or higher refers to third-degree obesity, or morbid obesity, which is a significant health risk and requires immediate specialist intervention.

    Understanding your BMI helps determine where you stand and what steps you need to take to maintain or achieve a healthy weight. However, it's important to remember that BMI is just one tool for assessing health and should be used in conjunction with other measures and consultation with specialists.

    Your body mass index, or BMI, is a key to helping you understand how your weight and height are in harmony and is a great aid in assessing your overall health. Here's a simple way you can calculate your BMI yourself and what you need to do to do it:

    First, find out your weight. This can be done with a regular home scale. Record it in kilograms to get the most accurate result.

    Next, measure your height. It is best to do this in meters for ease of calculation. If you originally measured your height in centimeters, remember to convert it to meters by dividing by 100.

    Now that you have both values, use the formula to calculate BMI: weight divided by the square of height. That is:

    BMI = Weight (kg) / (Height (m))^2

    For example, if you weigh 70 kg and are 1.75 meters tall, your BMI would be:

    IMT = 70 / (1.75 * 1.75) ≈ 22.86

    In summary, BMI helps you determine if your weight is within a normal range in relation to your height. It is a great way to start assessing your physical condition. However, it is important to remember that BMI does not take into account some important aspects such as muscle mass and overall body fat distribution. Therefore, it is always advisable to consult a professional for a more in-depth assessment of your health and fitness.

    Nutrition tips

    1. Product Variety: Include a wide variety of foods in your diet - fruits, vegetables, proteins, grains and dairy products. Variety will provide your body with all the nutrients it needs.

    2. Proper portions: Keep your food intake in moderation. Do not overeat or limit yourself too much. Gradually learn to listen to your feelings of hunger and satiety.

    3. Moderation in carbohydrates: Favor complex carbohydrates such as whole grains, vegetables and fruits. They are digested slowly and provide a long-lasting feeling of satiety.

    4. Healthy fats: Include unsaturated fats such as olive oil, nuts and fish in your diet. They promote heart and brain health.

    5. Protein for muscle: Make sure you have protein sources in your diet - meat, poultry, fish, eggs, legumes. These will help to maintain and develop muscle.

    6. Moderation in sweet and salty: Reduce your sugar and salt intake. These ingredients can affect heart health and overall health.

    Physical activity tips

    1. Choose an activity that you enjoy: Find physical activities that are enjoyable. It can be walking, running, swimming, yoga or dancing.

    2. Regularity: Engage in physical activity regularly, at least 150 minutes per week of moderate intensity or 75 minutes of vigorous exercise.

    3. Variety of exercises: Include a variety of exercises to work on all muscle groups and keep your workouts interesting.

    4. Warm-up and stretching: Don't forget warm-up exercises before your workout and stretching afterward. This will help prevent injury and improve flexibility.

    5. Gradual increase in load: If you are a beginner, start with small loads and gradually increase the intensity and volume of your workouts.

    6. Rest and Recuperation: Don't forget rest days for recovery. Maintaining a balance between exercise and rest is important to prevent overexertion.

    It's important to remember that before changing your diet or starting a new exercise program, it's best to consult with a medical professional or nutritionist to make sure the approach you choose is safe and right for you.

    Effects of gender and age on metabolism and BMI:

    Gender and metabolism: Men and women have different physiological characteristics that can affect their metabolism and ultimately their BMI.

    Metabolic rate: Typically, men have a higher metabolic rate than women, which means they burn more calories at rest. This is due to the higher level of muscle mass in men.

    Physiologic differences: Women tend to have more adipose tissue and men tend to have more muscle mass. Muscle mass requires more energy to maintain than fat tissue, so men may have a higher basal metabolic rate.

    Hormonal factors: Hormones also have an effect on metabolism. For example, estrogen levels in women can affect fat distribution and metabolic rate.

    Age and metabolism: Metabolism usually decreases with age. This is due to a decrease in muscle mass and overall body activity.

    Reduced muscle mass: As we age, muscle mass decreases, which decreases metabolic activity. Muscle requires more energy to maintain, so decreased muscle mass can lead to slower metabolism.

    Physical activity level: Often as we age, physical activity levels decrease, which can also affect metabolism. Less activity means fewer calories burned.

    Influence on the approach to healthy living: Given these physiologic differences, the approach to a healthy lifestyle may vary.

    Paul: Women may experience slower weight loss due to biological factors, but that doesn't mean they can't reach their goals. It is important for both sexes to pay attention to a healthy diet and regular physical activity.

    Age: Adults, especially after age 40, may need a more conscious approach to diet and exercise to maintain metabolism and muscle mass. Regular exercise with an emphasis on strength training can help preserve muscle mass and keep metabolism at a higher level.

    It is important to realize that regardless of gender or age, a healthy lifestyle that includes a balanced diet and regular physical activity remains key to maintaining optimal weight and overall health.

    Regular weight and BMI (Body Mass Index) measurements are key to maintaining a healthy lifestyle and achieving your fitness goals. Here's why it's so important:

    1. Progress Tracking: Regular measurements allow you to monitor how your weight and BMI change over time. This allows you to see if you are meeting your goals or if you need to make adjustments to your lifestyle.

    2. Early detection of change: Regular measurements can help you detect small changes in your weight and BMI, which can be a warning sign of potential health problems, such as being overweight or undernourished.

    3. Motivation: Watching your progress can be a powerful source of motivation. Gradual weight loss or maintaining a normal BMI can encourage you to continue your efforts.

    4. Adapting the strategy: Measurements help you evaluate how your eating habits and physical activity affect your condition. If the results do not match your expectations, you can adjust your strategies.

    Tips on proper measurement intervals and progress monitoring:

    1. Select an interval: Measure your weight and BMI regularly, but not too often. Once a week or every two weeks will be enough to track changes.

    2. Measure at the same time: Take your weight and BMI measurements at the same time of day, preferably in the morning after you go to the toilet and before you eat. This will help you get more accurate results.

    3. Use the same terms: Measure on the same weighing and measuring system each time. This will eliminate the possibility of confusion due to different measurements.

    4. Take notes: Record your weight and BMI measurements so you can see changes over time. You can use a notebook or an app to monitor.

    5. Analyze trends: Compare measurements over several weeks or months. Pay attention to trends and try to understand what factors may be influencing the changes.

    6. Don't fixate on weight alone: In addition to your weight and BMI, pay attention to how you feel physically, your energy level, and your overall health.

    Measurements are not only a monitoring tool, but also a way to be more conscious of your health and make informed decisions about your lifestyle.

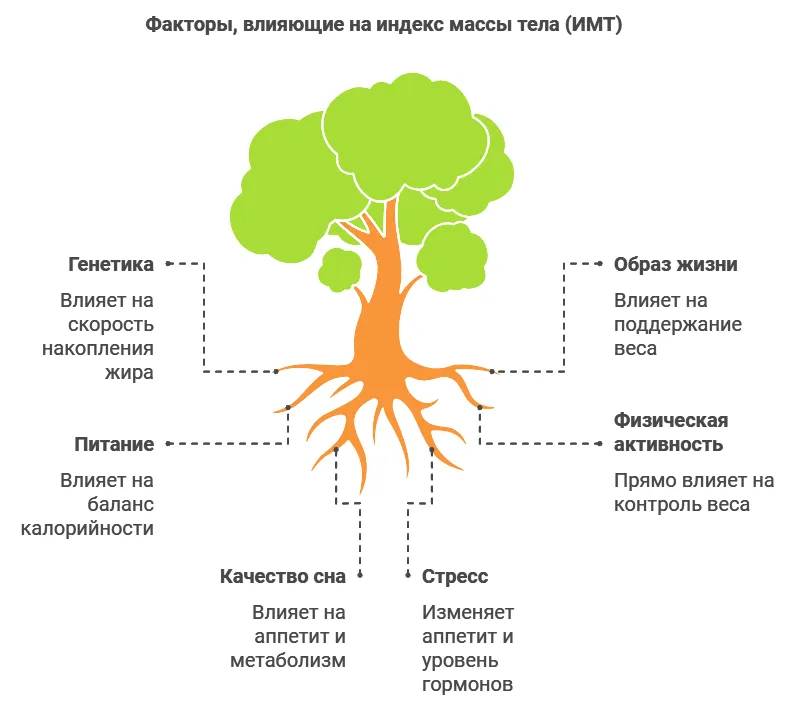
    Genetics: Genetic factors play an important role in determining your BMI. If you have relatives who are overweight or obese, you may be predisposed to these conditions.

    Lifestyle and physical activity: Physical activity level and lifestyle directly affect BMI. Lack of physical activity can lead to weight gain and fat storage.

    Food habits: Nutrition plays an important role in weight management and BMI. A diet rich in fast carbohydrates, fatty and high-calorie foods can contribute to excess weight gain.

    Psychological factors: Emotional overeating, stress, and poor psychological habits can affect eating behavior and contribute to weight change.

    Sleep and rest: Lack of sleep and chronic stress can affect hormonal balance and metabolism, which can lead to weight gain.

    Metabolic factors: Some people have a slower metabolism, which can contribute to a tendency to gain weight.

    Age: As we age, our metabolism usually declines, which can lead to weight gain.

    Social Environment: Environmental and cultural factors can influence eating habits and physical activity levels.

    Thyroid health and hormones: An imbalance of hormones, such as thyroid, can affect metabolism and weight.

    What aspects may increase your risk of developing overweight or obesity:

    1. Sedentary lifestyle: Lack of physical activity limits calorie burning and promotes fat storage.

    2. High-calorie foods: Overeating and eating foods high in calories and sugar can lead to overweight.

    3. Stress and emotions: Stress can trigger overeating and worsen eating behavior.

    4. Lack of sleep: Lack of sleep has been linked to changes in appetite and hormonal imbalances.

    5. Genetic predisposition: Some genes may contribute to fat accumulation.

    6. Social Environment: Environment and cultural factors can influence food choices and physical activity levels.

    7. Lifestyle change: An abrupt change in lifestyle, such as after a career in sports, can contribute to weight gain.

    8. Medical factors: Some medical conditions and medications can affect metabolism and weight.

    It is important to remember that several factors can interact and each body is unique. Leading a healthy lifestyle that includes a balanced diet and regular physical activity can help reduce the risk of developing overweight and obesity.

    The role of metabolism:

    Metabolism is the complex process by which the body converts food into the energy needed to sustain life. It involves several steps, such as digestion, absorption of nutrients, their transportation through the body, and their use for cell and tissue function.

    Effect on caloric intake:

    Metabolism plays a crucial role in calorie intake. Basal metabolism is the amount of calories the body expends at rest to maintain basic functions such as breathing, body heating, and organ function. A higher basal metabolism means that the body burns more calories even at rest.

    Metabolic activation:

    There are several ways to activate your metabolism:

    1. Physical Activity: Regular physical activity, such as cardio and strength training, can increase your metabolic rate. This is due to an increase in calorie burning during and after exercise.

    2. Proper nutrition: Eating foods high in protein, complex carbohydrates and healthy fats can help boost the metabolic process. It is also important not to skip meals to keep the body's energy supply constant.

    3. Variety of food: Change the composition of your diet periodically to avoid your body adapting to a particular diet.

    4. Proper sleep patterns: Sufficient sleep helps normalize hormonal balance, which affects metabolism.

    Regular physical activity to maintain a healthy metabolism:

    Regular physical activity is essential for maintaining a healthy metabolism and optimal weight. Here's why they are important:

    1. Increased caloric expenditure: Exercise helps burn calories, which can be important for weight management.

    2. Maintaining muscle mass: Physical activity helps to strengthen muscles and maintain muscle mass. This is important because muscle burns more calories than fatty tissue.

    3. Improved metabolism: Regular exercise can increase your basal metabolism, allowing you to burn more calories at rest.

    4. Reducing the risk of disease: Physical activity is associated with improved cardiovascular health and reduced risk of diabetes and other chronic diseases.

    5. Maintaining energy: Regular exercise can improve energy levels and overall health.

    6. Stimulation of metabolism: Intense workouts can contribute to the "post-workout oxygen debt effect," where the body recovers and burns calories even after the workout is over.

    It is important to choose physical activities that are enjoyable and incorporate them into your life on a regular basis. The combination of a healthy diet and an active lifestyle will help you maintain a healthy metabolism and achieve the results you want.

    The importance of psychological health:

    Mental health plays a fundamental role in overall well-being and quality of life. It is a state of mental balance that enables you to cope with life's challenges, maintain positive relationships and make informed decisions. Psychological health affects all areas of life, including physical health and lifestyle.

    The impact of stress and emotions on weight and lifestyle:

    Stress and emotions have a direct impact on weight and lifestyle:

    1. Overeating: Stress can lead to emotional overeating, where food becomes a way to cope with emotional difficulties. This can lead to weight gain.

    2. Food Choices: In times of stress and negative emotions, we often tend to choose comfort foods rich in sugar and fat rather than the healthiest foods.

    3. Physical Activity: Stress can affect motivation to engage in physical activity. Some people may stop paying attention to exercise because of emotional discomfort.

    Stress Management Tips:

    1. Relaxation practice: Try relaxation techniques such as meditation, deep breathing, yoga or walking in the fresh air.

    2. Physical Activity: Regular exercise helps to reduce stress levels and improve your mood through the release of endorphins.

    3. Supportive Environment: Talk to loved ones, friends, or professional counselors. Feeling supported and understood can help to release accumulated stress.

    4. Proper nutrition: Eating a balanced diet with nutritious foods can help improve the health of the nervous system.

    5. Time Management: Organize your time to avoid overwork and stress due to lack of time.

    6. Hobby Activities: Engaging in a hobby that is enjoyable can help take your mind off stress.

    7. Sleep: Ensure you get enough sleep, as good sleep is important for psychological and physical health.

    Remember, stress management is an important aspect of maintaining overall health and achieving lifestyle balance.

    Longevity and long term health is the result of a balanced lifestyle and self-care. Here are some tips and practices that can help you achieve longevity and improve your quality of life:

    1. Proper nutrition: Try to eat a variety of foods rich in vitamins, minerals and antioxidants. Moderately limit your intake of processed foods, sugar and salt.

    2. Physical Activity: Regular physical activity can help strengthen your muscles, maintain flexibility and improve your overall stamina. Even simple walks, yoga or swimming can be beneficial.

    3. Sleep and rest: Follow a sleep schedule to allow your body to repair and renew itself. Quality sleep promotes brain health and overall well-being.

    4. Stress Management: Practice relaxation techniques, meditation, breathing exercises. Learning to cope with stress will help improve psychological health.

    5. Social Connections: Maintain close relationships with friends and family. Communication and support are important for psychological comfort.

    6. Mental Activity: Engage in mental exercises, solve puzzles, and read books. This will help keep your brain healthy and improve your cognitive abilities.

    7. Regular medical examinations: Have regular check-ups and consultations with your doctors for early detection and prevention of diseases.

    8. Skin Care: Protect your skin from the sun's UV rays, keep it moisturized and use quality skin care products.

    9. Maintaining a positive mood: Teach yourself to look at life on the positive side, do your favorite things, rejoice in the little things.

    10. Mental Harmony: Practice meditation, prayer, or other methods that will help you find inner peace and harmony.

    11. Dental Care and Hygiene: Follow good dental hygiene habits and promote oral health.

    12. Continuing Education: Learn something new, develop your skills and interests even in your old age.

    13. Maintaining Optimism: It's important to believe in your capabilities and find joy in the moments of life.

    The secret of longevity lies in the harmony of physical, psychological and emotional health. Use these practices to create a foundation for a long and happy life.

    1. "Very low-fat diets can help you lose weight fast."

    Fact: Diets that are extremely low in fat can lead to deficiencies in essential fat-soluble vitamins and negatively impact your overall health.

    2. "The more exercise you do, the faster you'll lose weight."

    Fact: The quality of exercise is more important than the quantity. Moderate but regular physical activity is more effective and safer.

    3. "Skipping rope will eradicate belly fat deposits."

    Fact: Exercise alone will not remove fat from certain areas of the body. Overall weight loss is important for fat loss.

    4. "Skipping breakfast can help you lose weight."

    Fact: Eating breakfast helps activate your metabolism and keeps you energized. Skipping meals can disrupt lunch and promote overeating.

    5. "Healthy foods are expensive and unaffordable."

    Disinformation: Healthy foods are available in a variety of price points. Seasonal fruits, vegetables, protein, buckwheat and other nutritious foods can be affordable and budget-friendly.

    6. "Calorie-free diet drinks are healthier than regular drinks."

    Disinformation: Some studies have linked diet drinks to increased appetite and other negative effects. Water remains the healthiest choice.

    7. "All fats are harmful, they should be completely eliminated."

    Disinformation: Some fats, such as polyunsaturated fatty acids, are good for the body and are necessary for normal function.

    8. "Protein supplements and shakes for weight loss are magical."

    Disinformation: Protein supplements are no substitute for a balanced diet. Weight loss shakes often do not provide long-term results.

    9. "Training should always be intense."

    Disinformation: Intense training is important, but the body also needs rest and recovery. Monotonous intensity can lead to fatigue.

    10. "A healthy lifestyle is only diet and exercise."

    Fact: A healthy lifestyle includes a balance of nutrition, physical activity, psychological well-being, adequate sleep and stress management.

    Knowing the facts and the difference between myths and reality will help you make informed decisions and live a healthy lifestyle.

    Water is not just a vital fluid, it is the foundation of our body and health. Consuming enough water plays a key role in keeping your body hydrated and in overall health. That's why water is so important:

    1. Hydration of organs and tissues: Water makes up a significant part of our cells, tissues and organs. It is involved in all physiological processes, helping to deliver nutrients, oxygen and remove waste.

    2. Temperature regulation: Water serves as a natural regulator of body temperature. By sweating, it helps cool the body during physical activity or in hot weather.

    3. Maintaining digestion: Water participates in the digestive process by diluting food and helping nutrients to be absorbed more efficiently.

    4. Joint lubrication and organ protection: Water serves as an internal "lubricant," reducing friction between joints and organs, which keeps them functioning properly.

    5. Waste elimination: Water helps flush toxins and waste out of the body through the kidneys and bladder.

    6. Level of energy and concentration: Lack of water can lead to lower energy levels, impaired concentration and a general feeling of fatigue.

    7. Skin Health: With the right level of hydration, skin looks firmer, more radiant and less prone to dryness.

    8. Maintaining general health: Drinking enough water contributes to overall physical and psychological health.

    It is recommended to consume about 8 glasses (2 liters) of water per day, but individual needs may vary depending on activity, climate, and physiological characteristics. Drinking water regularly is an essential part of taking care of yourself and your health.

    The impact of poor quality sleep on health:

    Lack of sleep and poor quality sleep can have serious consequences for your overall health and well-being. Here's how it can affect the body:

    1. Psychological state: Lack of sleep can lead to moodiness, irritability, apathy and even depression.

    2. Weakened immune system: Insufficient sleep reduces the activity of the immune system, making the body more vulnerable to infections and diseases.

    3. Increased risk of disease: Lack of sleep has been linked to an increased risk of cardiovascular disease, diabetes, obesity, and other chronic conditions.

    4. Cognitive deterioration: Lack of sleep can reduce concentration, memory, attention, and decision-making abilities.

    5. Physical Endurance: Lack of sleep can impair physical endurance and ability to recover from exercise.

    6. Metabolic problems: Lack of sleep can affect hormonal balance and impair appetite and metabolic control.

    Tips for improving the quality of your sleep:

    1. Create a regular mode: Go to bed and get up at the same time, even on weekends. This will help synchronize your biological clock.

    2. Create a comfortable atmosphere: A dark, cool and quiet room is conducive to deep sleep.

    3. Avoid heavy food and alcohol before bedtime: It can interfere with the quality of sleep.

    4. Adjust the screen time: Avoid brightly lit computer and smartphone screens before bedtime, as this can affect melatonin production.

    5. Practice relaxation: Meditation, deep breathing, or a warm bath before bed can help you relax.

    6. Moderate physical activity: Regular exercise promotes deep sleep, but avoid intense workouts just before bedtime.

    7. Avoid long naps: Long daytime naps can disrupt nighttime sleep.

    8. Limit your caffeine intake: Avoid caffeine and other stimulants closer to evening.

    9. Maintain a relaxation routine: Reading, quiet music, or other quiet activities before bedtime can help your body go into rest mode.

    Improving the quality of your sleep can have a significant impact on your life and health. Try to create optimal conditions for rest and pay enough attention to your sleep.

    Skin health is largely dependent on nutrition. Foods that are rich in antioxidants, vitamins and nutrients can contribute to youthful, firm and glowing skin. Here are some foods that are particularly beneficial for skin health:

    1. Berries: Blueberries, blueberries, raspberries, and strawberries are all rich in antioxidants that help protect the skin from free radical damage.

    2. nuts and seeds: Almonds, walnuts, flaxseed and chia seeds contain vitamin E and valuable fatty acids to keep skin moisturized and healthy.

    3. Olive oil: Rich in monounsaturated fats, olive oil helps smooth skin and protect against inflammation.

    4. Fish: Fatty fish such as salmon, tuna and sardines contain omega-3 fatty acids that keep you moisturized and protect against inflammation.

    5. Green tea: Rich in polyphenols, green tea can help reduce skin inflammation and improve overall health.

    6. Citrus fruits: Oranges, grapefruit, lemons and limes contain vitamin C, which promotes collagen formation and fights damage.

    7. Greens: Spinach, potato leaves, and parsley are sources of vitamin K, which helps reduce bruising and strengthen blood vessels.

    8. Dark vegetables: Sweet potatoes, pumpkin, and carrots contain beta-carotene, which helps maintain the skin's natural glow.

    9. Whole grains: Oats, quinoa, barley - rich in B vitamins that help in skin cell regeneration.

    10. Water: Don't forget the water! Moisturizing from the inside out is important to keep your skin supple and healthy.

    Adding these foods to your diet can not only promote healthy skin, but also overall body health. Remember, a balanced diet combined with proper care creates the foundation for beautiful and healthy skin.

    Linking health and emotion:

    The connection between emotional well-being and physical health is an integral part of our lives. Our emotions and moods can have a profound impact on our bodies and overall well-being.

    1. Impact of stress: Negative emotions such as stress, anxiety and depression can affect our immune system, making the body more vulnerable to infections and diseases.

    2. Effects on the cardiovascular system: Constant stress can increase the risk of developing cardiovascular diseases such as hypertension and heart disease.

    3. Physiologic responses: Strong emotions can trigger physiologic reactions such as rapid heartbeat, increased blood pressure, and muscle tension.

    4. Sleep and eating habits: Emotional stress can affect sleep and eating habits, which in turn can affect metabolism and overall health.

    5. The ability to be conscientious: Constant stress can hamper our ability to stay in the moment and enjoy life.

    The role of Relaxation and Meditation practices:

    Practices of relaxation, meditation, and mental harmony can be effective tools for maintaining emotional balance and improving physical health:

    1. Stress reduction: Regular practice of relaxation and meditation can reduce stress and anxiety levels, improving psychological and physical well-being.

    2. Sleep Improvement: Relaxation practices can promote relaxation before bedtime, improving the quality and duration of sleep.

    3. Emotion regulation: Meditation helps you to consciously manage your emotions by developing skills in responding instead of reacting.

    4. Raising awareness: Meditation promotes a deeper understanding of yourself, your emotions and needs.

    5. Improved physical condition: Relaxation practices can reduce muscle tension, improve breathing, and even affect blood pressure readings.

    6. Strengthening the immune system: Regular relaxation practices can strengthen the immune system, helping to fight infections more effectively.

    7. Improved well-being: Relaxation and meditation practices can give you moments of peace, promoting an overall sense of well-being.

    Applying these practices to your daily life can help balance your emotions and physical health, helping you to better cope with challenges and enjoy a fulfilling life.

    A healthy lifestyle is of great importance in the prevention of various chronic diseases. Making positive changes in your life can significantly reduce your risk of developing conditions such as diabetes, cardiovascular disease, and many others. Here's how it works:

    1. Healthy eating: A proper diet is rich in nutrients, vitamins and minerals. Limiting sugar, salt and saturated fat intake helps prevent diabetes, hypertension and atherosclerosis.

    2. Physical Activity: Regular exercise supports cardiovascular health, strengthens muscles and bones, and helps control weight.

    3. Weight control: A healthy weight reduces the risk of many diseases, including type 2 diabetes, hypertension and some forms of cancer.

    4. No smoking: Smoking cessation reduces the likelihood of developing chronic respiratory disease, cardiovascular disease, and cancer.

    5. Moderate alcohol consumption: Limited alcohol consumption is associated with a reduced risk of cardiovascular disease.

    6. Regular medical examinations: Regular visits to your doctor can identify potential problems early and prevent diseases from developing.

    7. Stress control: Relaxation and stress management practices help reduce the effects of stressors on the body, preventing the development of chronic conditions.

    8. Healthy sleep: Getting a full night's sleep helps the body recover, supports the immune system and improves overall physical and psychological well-being.

    9. Chronic condition management: If you have a chronic condition, following your doctor's recommendations and proper treatment can help control the condition and prevent it from worsening.

    Realizing that a healthy lifestyle can reduce the risk of developing many chronic diseases makes prevention especially important. Simple changes in daily habits can play a huge role in maintaining long-term health and quality of life.

    Positive habits play an important role in achieving and maintaining a healthy lifestyle. They help us establish stability, discipline, and internal motivation to successfully achieve our health goals. Here's how it works:

    1. Gradual implementation of changes: Positive habits allow you to implement changes gradually, making the process more manageable and less scary. This is especially important for those who are seeking radical lifestyle changes.

    2. Establishing routines: Forming habits helps create a stable routine that promotes a more predictable and organized lifestyle.

    3. Automation support: When positive habits become a natural part of daily life, they automatically support a healthy lifestyle without requiring constant effort.

    4. Increased motivation: Regularly implementing positive habits can be a source of internal motivation as we see positive results and feel successful.

    5. Overcoming resistance: Often in the initial stages of change we encounter resistance and difficulties. Positive habits help us overcome these barriers and keep moving forward.

    6. Strengthening discipline: Forming habits requires discipline and regularity. This helps develop the ability to manage yourself and stick to a plan.

    7. Long term sustainability: Positive habits contribute to the long-term sustainability of a healthy lifestyle because they are built on the principles of consistency and stability.

    8. Stress reduction: When healthy living becomes a habit, it reduces stress and anxiety as we feel more confident and in control.

    Examples of positive habits:

    • Regular morning exercise.
    • Eating healthy foods and moderate portions.
    • Schedule time for rest and relaxation every day.
    • Practice meditation or deep breathing before bed.
    • Setting goals and tracking your progress.

    Forming positive habits takes time and effort, but they can be reliable assistants on the path to a healthy lifestyle. Consciously build your habits, giving them time to take root and become part of your natural daily life.

    Involving friends and family in supporting a healthy lifestyle can make your journey to wellness much easier. The general atmosphere of support promotes motivation, inspiration and makes the process more fun. Here are some tips:

    1. Explain your motives: Tell your loved ones why taking care of your health is important to you. Share your goals and ambitions so they can understand you better.

    2. Invite to participate: Encourage friends or family members to try new activities, foods, or physical activities together. Sharing time together strengthens connections and makes the process more interesting.

    3. Create common goals: Set general healthy goals, such as taking part in a race or living a healthy lifestyle for a certain period. This will motivate all group members.

    4. Exchange of experience: Tell each other about your achievements and progress. This will create healthy competition and support in achieving goals.

    5. Cooking together: Spend time together cooking delicious and healthy meals. This is not only a way to support healthy eating, but also create a cozy atmosphere.

    6. Sports events: Participate in sporting events, such as family runs or bike rides. This is a great opportunity to spend time together and support each other.

    7. Mutual support: Be each other's support in moments of weakness or doubt. It is important to know that you can always ask for advice and support.

    8. Positive Feedback: Support each other with positive feedback as you reach your goals. Small successes deserve praise too.

    9. The importance of diversity: Variety in classes and activities makes the process more interesting. Try new types of workouts or activities together.

    10. Share knowledge: Exchange information about healthy living, nutrition and exercise. This promotes learning from each other.

    Creating an overall supportive environment makes the journey to a healthy lifestyle more enjoyable and successful. Health is a valuable resource that you can strengthen together with your loved ones, making it an inspiring and fun process.

    Research and verification of BMI calculator

    This calculator was created based on the study below, it was also verified by Jane A. Smith, the study itself is written in English, we translated it and posted it on the page of this calculator, the link to the article will be at the very bottom of this study.

    The text in this calculator with facts and conclusions is verified through - Fact Checker

    Annotation

    The relationship between body mass index (BMI) and body fat percentage may vary by age, gender, and race. Our goal was to determine in what contexts BMI may be a good predictor of body fat percentage compared with data obtained using dual-energy X-ray absorptiometry (DXA). The study included 18,061 participants (9,141 men and 8,920 women) aged 18 years or older who completed the DEXA study from 1999 to 2006 as part of the National Health and Nutrition Examination Survey (NHANES), as well as 8,107 men and 10,754 women with DXA data from the Korean Health and Nutrition Examination Survey (Korea NHANES) from 2008 to 2011 to represent an Asian population. We calculated Pearson correlation coefficients between BMI and DEXA fat index (FMI) and percentage body fat (PBF) by age, sex, and race. The correlation between BMI, FMI and PBF and obesity-related biomarkers was also assessed in the subgroup with DEXA data and information on each biomarker. BMI was highly correlated with FMI (r = 0.944 in men and 0.976 in women), PBF (r = 0.735 in men and 0.799 in women), and trunk fat mass (r = 0.914 in men and 0.941 in women), with stronger correlations in women compared with men, with the exception of the waist-height relationship (r = 0.921 in men and 0.911 in women). The correlation between BMI and fat mass measured by DEXA weakened with age in both sexes. BMI was less correlated with FMI (r = 0.840 in men and 0.912 in women), PBF (r = 0.645 in men and 0.681 in women), and trunk fat mass (r = 0.836 in men and 0.884 in women) in a Korean population according to compared to other racial and ethnic groups. Among biomarkers associated with obesity, insulin was found to be most strongly associated with measures of body fat mass in both sexes, and the strength of these correlations tended to decrease with age. BMI predicted obesity-related biomarkers as well as FMI and trunk fat mass, and even better than PBF. BMI may be a good indicator of body fat percentage, especially among younger groups, women, and the US population, but is less accurate among Korean populations. The decreased correlation between BMI and body fat percentage in older compared with younger groups may be due to increased PBF and decreased leukophyte mass.

    Introduction

    Body mass index (BMI) is widely used to assess obesity because it is simple and cheap to measure. However, BMI does not differentiate between fat mass and muscle mass. Typically, BMI has a good correlation with body fat percentage, with correlation coefficients ranging from 0.72 to 0.86, but this correlation varies by age, gender, and ethnicity. A study of 23,627 UK adults found that age had an independent effect on body fat percentage. Fat percentage increases with age at a constant BMI due to a gradual increase in fat mass and a slight decrease in muscle mass. In one study, BMI and waist circumference (WC) correlated well with body fat percentage, but this correlation decreased as participants aged. For example, men aged 20 to 39 years had a higher correlation between BMI and body fat percentage (r = 0.789) than men aged 80 years and older (r = 0.716). Similarly, a study of 202 black and 504 white adults found that older adults had a higher percentage of body fat compared to younger adults at the same BMI, regardless of ethnicity. Meanwhile, the relationship between BMI and body fat percentage also varies by ethnicity. Asians have a lower BMI but a higher percentage of body fat compared to whites of the same age. Blacks tend to have higher bone density, body protein, and muscle mass compared to whites, leading to differences in the relationship between BMI and body fat percentage.

    Belly adiposity, reflected by WC and trunk fat mass, also has different patterns depending on age, gender and ethnicity. Men and women of all ethnic groups increase core fat mass with age, but the relationship between this and BMI varies by age, gender and ethnicity has been less studied. Asian ethnicity groups have lower WC values compared with whites, but lower WC thresholds for cardiometabolic disease risk factors compared with whites, as WC correlates with skeletal size and height. In this context, an important correlating factor for fat content indices has been identified - body height. Body height has an inverse relationship with BMI, indicating that shorter height is associated with higher BMI. The use of body-to-height ratio (WHtR) has been proposed as a more sensitive index of trunk fat mass and a more accurate predictor of cardiovascular risk than BMI.

    In addition, fat indexes are associated with cardiometabolic biomarkers, leading to obesity comorbidities such as diabetes, coronary artery disease, and some cancers caused by insulin resistance, impaired endothelial function, and lipid metabolism. Although higher BMI itself is associated with insulin resistance and metabolic syndrome, percentage body fat may be more closely associated with cardiovascular risk than BMI. Moreover, a normal BMI with a high percentage of body fat had a four times higher prevalence of metabolic syndrome compared with a normal BMI with a low percentage of body fat. Recent research suggests that studying body composition may be more effective than BMI for studying health outcomes. However, the association between body fat mass and cardiometabolic biomarkers across age, sex, and ethnic group has not been fully explored.

    Because the Asian American population in the US is a growing subpopulation and made up 6.2% of the US population in 2020, the National Health and Nutrition Examination Survey (NHANES) began identifying Asian Americans from other ethnic groups in 2011. Until 2011, the Asian population was included in the “other” ethnic group category without specific categorization in the US NHANES data. Therefore, we added the Korean population from the Korean National Health and Nutrition Examination Survey, which contains information on body composition measured by the same methods as in the US NHANES data. The Asian population in the United States was estimated at 1.5 million and ranked fifth among the Asian populations in the United States.

    Therefore, the purpose of this study was to evaluate in what context BMI more accurately reflects fat mass as hypothesized as a function of age, sex, race/ethnicity, and presence of chronic disease, using nationally representative population samples from the United States and South Korea. In addition, we sought to examine how well indices of fat content, particularly fat mass and percentage body fat, compare with BMI in terms of correlations with biomarkers of obesity and how these correlations vary by sex and age.

    Study and Study Population

    The National Health and Nutrition Examination Survey (NHANES) is a series of cross-sectional surveys of the noninstitutionalized civilian population of the United States selected using complex multilevel probability sampling. For our study, we used data from 1999 to 2006 to be able to use body composition information assessed using dual-energy X-ray absorptiometry (DXA). The study population initially included 20,378 participants over 18 years of age who had DXA measurement information available. After excluding those who had strong variation in DXA data due to missing information on weight and waist circumference or those who had missing data due to pregnancy (n = 1593) and those who had missing anthropometric measurements (n = 724), we ultimately included 18,061 participants (9141 men and 8920 women). For the Korean Health and Nutrition Examination Survey (KNHANES), we included 18,861 participants (8107 men and 10,754 women) over 18 years of age who completed DXA screening from 2008 to 2011, after excluding data on DXA absence, BMI, and waist circumference (n = 679). Both datasets used subsets including participants who had information on each biomarker when conducting correlation analyzes between body composition and obesity-related biomarkers. The NHANES and KNHANES data are publicly available without personally identifiable information and were exempt from ethical approval as a secondary analysis of publicly available data.

    Anthropometry and body composition measurements

    Anthropometric measurements such as height (in centimeters), weight (in kilograms), and waist circumference (in centimeters) were performed by experienced technicians using standardized protocols. Waist circumference was measured at the most superior lateral point of the ilium. Body mass index (BMI) was calculated as the ratio of weight (in kilograms) to the square of height (in meters) and divided into four categories (< 18.5, 18.5–24.9, 25–29.9, ≥ 30 kg /m2) in accordance with the criteria of the World Health Organization.

    Whole-body DXA examinations were performed at the Mobile Examination Center using a Hologic QDR 4500A fan-beam X-ray densitometer (Hologic Inc., Waltham, MA, USA). DXA scans were quality checked and analyzed using Hologic Discovery software (version 12.1). Our study used data on whole body fat mass, whole body lean mass, and percentage body fat. To account for the effects of body size, fat mass and lean tissue mass were converted into fat mass index (fat mass [in kilograms] divided by the square of height [in meters]) and lean tissue mass index (dry tissue mass [in kilograms] divided by the square of height [in meters]), given that the mass of fat and dry tissue largely depends on height. The fatty region determined by DXA includes subcutaneous and intermuscular fat of the neck, trunk and pelvis. The limb lean tissue index was calculated as the sum of skeletal muscle in the arms and legs measured by DXA scans divided by the square of height (in meters), equivalent to all lean and non-fat tissue. To examine differential correlations between these measures across race/ethnicity groups, DQSA data from KNHANES were additionally used because the NHANES data did not separate out or include a large enough Asian ethnic population. In KNHANES, whole-body DXA studies were performed on the same equipment as in NHANES (Hologic QDR 4500A) and analyzed using standard techniques using Hologic Discovery software (version 13.1) in its standard configuration.

    Other factors

    Age was categorized as follows: 18–29 years, 30–39 years, 40–49 years, 50–59 years, 60–69 years, and over 70 years. Race/ethnicity was categorized as White, African American, Mexican American, other Hispanic and other, and Korean. For analyzes of racial differences, data from NHANES were excluded because we were unable to determine specific race/ethnicity due to missing information. Smoking was divided into three categories: never smoked, former smokers, and current smokers, based on a self-report questionnaire. The presence of chronic diseases was defined as participants having at least one of the following chronic diseases: cancer, coronary heart disease, heart failure, stroke, thyroid disease, chronic lung disease, and liver disease. Total cholesterol (TC), low-density lipoprotein (LDL) cholesterol, high-density lipoprotein (HDL) cholesterol and triglyceride levels, C-reactive protein (CRP) levels, serum glucose and insulin levels were measured using standard methods.

    Data analysis

    SAS version 9.4 (SAS Institute INC.) and SAS-callable SUDAAN (Research Triangle Institute) software were used to perform the analysis. All analyzes controlled for sample weights and multiple imputations.

    Multiple imputations were used to process densitometry (DXA) data. Raw DXA data was corrupted or missing for some study participants. A multiple imputation technique provided by the National Center for Health Statistics was used to reconstruct these data. This technique allowed for five different options for recovering missing data.

    Older and obese individuals are known to have higher rates of missing DXA data in the NHANES study. That is why multiple imputation was used to recover the lost data.

    Next, we assessed weighted Pearson correlation coefficients between measures of body composition (fat mass index, percent body fat, leukemia mass index, trunk fat mass, and limb muscle mass index) and BMI in each age-sex group. We also examined weighted correlations between obesity-related biomarkers (eg, cholesterol, C-reactive protein, and insulin) and body composition measures (BMI, fat mass index, and percentage body fat). Partial Pearson correlation, adjusting for age, was used to determine the relationship between BMI and DXA data across chronic conditions.

    To compare characteristics between men and women, t-tests were performed for continuous variables and chi-square tests for categorical variables.

    Ethics and approval

    For each study (NHANES and Korea NHANES), the appropriate institutional or national ethical review board approved the survey. All participants provided written informed consent, and the institutional review board (IRB) of the US Centers for Disease Control and the Korea Centers for Disease Control (KCDC) approved the study (IRB: Protocol No. 98-12 and Protocol No. 2005-06 for NHANES 2008 -04EXP-01-C, 2009-01CON-03-2C, 2010-02CON-21-C and 2011-02CON-06-C for Korea NHANES).

    It is emphasized that all survey participants gave their written consent to participate, and the relevant ethical committees approved the study. This ensures that ethical standards and principles are observed during research.

    Characteristics of the study population

    The Supplementary Table provides descriptive data on the study population stratified by gender. Mean age was 43.2 (standard error [SE] 0.3) for men and 45.3 (SE 0.3) for women. In KNHANES, mean age was 43.2 (SE 0.3) for men and 45.5 (SE 0.3) for women. The distribution of participants by age category was 21.8% (18–29 years), 20.1% (30–39 years), 22.1% (40–49 years), 17.0% (50–59 years), 10.8% (60–69 years) ) and 8.2% (≥ 70 years). The mean body mass index (BMI) was higher in women compared to men (28.2 vs. 27.9 kg/m²). Women also had a higher prevalence of abdominal obesity by sex-specific criteria than men (57.8% vs. 39.5%). Men had 5.5 kg less fat mass and 17.7 kg more muscle mass, resulting in an 11.9% lower body fat percentage compared to women. The majority of participants were white (71.1%). In terms of biomarkers, men had higher LDL cholesterol, lower HDL cholesterol, and lower insulin levels compared to women. The distribution of the Korean population by age group was 21.0% (18–29 years), 21.2% (30–39 years), 21.9% (40–49 years), 17.1% (50–59 years), 10.2% (60–69 years) ) and 8.6% (≥ 70 years). Korean men had higher BMI (24.0 vs. 23.1 kg/m²), waist circumference (83.7 vs. 77.6 cm), and lower body fat percentage (22.0 vs. 32.9%) compared with Korean women.

    Comparisons between included and excluded populations are presented in the Supplementary Table. The included population tends to be less obese compared with the excluded population in NHANES.

    Relationships between BMI and indicators

    Relationships between BMI and BMI (Body Mass Index, Fat Mass Index, and Lean Mass Index) by Age, Sex, and Ethnicity

    The table presents the mean body measurements and Pearson's correlation coefficients between BMI and DQSA-derived measures (fat mass index, percentage fat mass, and lean mass index) by age and sex for each group. Body mass index showed a linear relationship with fat mass index and a curvilinear relationship with percentage fat mass in all age and sex groups. Fat mass index had a stronger correlation with BMI than percentage fat mass in all age and sex groups. Correlations between BMI and fat mass index, percentage fat mass, lean mass index, and limb muscle index were generally high, but slightly higher in women than in men. Overall, BMI, waist circumference, and fat mass index tended to increase with age up to 60–69 years in both men and women, and then decreased slightly thereafter. The waist-to-height ratio increased with age. The muscle mass index also increased to a maximum of 19.7 kg/m2 in men aged 40-49 years and 16.3 kg/m2 in women aged 40-49 years, and had the lowest values in men and women aged 70 years and older (17.9 kg/m2 for men and 15.2 kg/m2 for women). Meanwhile, percentage of fat mass showed an increase with age in both men and women.

    The strength of the correlation between fat mass index and BMI tended to decrease slightly with age in the US population, particularly among participants over 60 years of age in both men and women, resulting in the lowest correlation, but still high, in those who are over 70 years old (r = 0.932 for men and r = 0.965 for women). The degree of correlation between percent fat mass and BMI also decreased with age. In terms of fat distribution, the correlation between BMI and measures of abdominal adiposity (waist circumference, trunk fat mass, and waist-to-height ratio) decreased with age.

    Women had higher correlations between DXA-derived fat mass index (fat mass index and percentage fat mass) and BMI compared to men in all different ethnic groups. Higher correlations were observed among whites, blacks, and Mexican-Americans compared to Koreans. The degree of correlation between fat mass index, percentage fat mass, and trunk fat mass and BMI in Koreans showed different patterns depending on age; There was a minimum in the group aged 50-59 years and an ascending curve. This is in contrast to the generally more linear decreasing relationship in other ethnic groups.

    Correlations between WHtR and DXA scores by age and gender

    Supplementary Table 3 presents the Pearson correlation coefficients between the WHtR index and the DXA-derived scores. In contrast to the correlation of fat mass index and percentage body fat with BMI, which was stronger in women than in men, the correlation between fat mass index and percentage body fat with the WHtR index was stronger in men than in women. The degree to which fat mass index and percentage body fat correlated with WHtR decreased with age in NHANES, while among Koreans the lowest correlation was observed in the 50–59 age group. The correlation between WHtR and body fat percentage was generally stronger than the correlation between BMI and body fat percentage.

    Association between BMI and DKA in chronic diseases

    Overall, BMI, adipose indices, and muscle mass index tended to increase in the chronic disease groups, with the exception of a decrease in muscle mass index in patients with a history of cancer (see Supplementary Table 4). Taking into account the presence of chronic diseases, the correlation between BMI and percentage of fat mass/fat mass index seemed similar in both groups.

    Additionally, it is worth noting that more detailed investigation of the relationships between BMI and DKA scores in chronic diseases may provide valuable data on the relationship between total body weight and body composition in patients.

    Correlation of adiposity measures with biomarkers

    Figures 2 and 3 show the association of adiposity measures (BMI, fat mass index, and percentage fat mass) with biomarkers associated with obesity by age in men and women. BMI, fat mass index, and percentage fat mass showed significant correlation with each of the biomarkers in both men (r ≤ 0.491) and women (r ≤ 0.647). Overall, correlations between BMI, fat mass index, and percentage fat mass with biomarkers were comparable, and none were clearly superior. Among the biomarkers, the highest correlation was observed with insulin in both men and women. However, the correlation between insulin and fat mass index in men decreased linearly with age (eg, r = 0.575 in men aged 18–29 years and 0.351 in men aged ≥ 70 years).

    Koreans showed similar trends, consistent with data from the NHANES study. The correlation between anthropometric measures and biomarkers tended to decrease with age in all groups, with the exception of insulin in Korean men, in which the correlation remained almost constant across all age groups. It is particularly interesting that the correlation with insulin in young Korean men was not as strong as in the NHANES study. Abdominal fat mass showed similar trends: the correlation between waist circumference/trunk fat mass and insulin decreased linearly with age in men (see Appendix Figure 7). The difference in area under the curve (AUC) for identifying insulin resistance using the homeostatic insulin level assessment model (thresholds ≥ 3) between different adipose indices was found to be negligible (see Appendix Figure 8). In the American population, males had a higher AUC than females, while Korean females had a higher AUC than males.

    Discussion

    This study assessed the degree of correlation between body mass index (BMI) and fat mass measured by dual X-ray absorption (DXA) densitometry by sex, age groups, race/ethnicity, and the presence of chronic diseases. In addition, the correlation between fat mass and obesity-related biomarkers was examined by sex and age. Our results showed that BMI better reflects fat mass index and body fat percentage in women compared with men, in younger age groups compared with older age groups, and in Caucasian/African-American/Mexican-American races compared Koreans (Asians). Among biomarkers associated with obesity, insulin was most strongly correlated with BMI, fat mass index, and percentage body fat, and this correlation decreased with age. BMI and fat mass index correlated with biomarkers approximately equally and were slightly more informative than percent body fat.

    Previous studies have assessed the relationship between BMI and DXA fat mass in different contexts. Overall, fat mass was more strongly correlated with BMI than with body fat percentage, consistent with our results. We found that percentage body fat has a curvilinear relationship with BMI, where the slope of the curve between percentage body fat and BMI is steeper at lower BMI values. A previous study of 665 African Americans and whites also reported that the relationship between BMI and percent body fat was quadratic in individuals with a BMI ≥ 35 kg/m2. The negative regression coefficient of the quadratic term for BMI in our results confirms the curvilinear relationship between BMI and percentage body fat (data not shown, p-value < 0.001). When comparing men and women, the correlation between BMI and DXA-derived fat mass measures was stronger in women compared to men. Women have relatively more fat mass compared to men. This difference between the sexes persists even into childhood, with girls aged 5-9 years having more fat mass than boys. BMI was more strongly correlated with waist circumference in men than in women, due to differences in fat distribution. Women have relatively more fatty tissue in their hips and thighs than men, who have abdominal obesity.

    The relationship between BMI (body mass index) and percentage fat mass changes with age in adults, as suggested by several studies. Previous results showing that the correlation between BMI and percentage fat mass weakens with age are consistent with our data1. BMI is a suboptimal indicator of percentage fat mass in older adults, especially those with a BMI ≥ 30 kg/m2. Meanwhile, a study based on KNHANES found no weakening of the correlation between BMI and percentage fat mass with age, and a study in Switzerland found a stronger association between fat mass and BMI in adults aged 50 to 84 years compared to those was aged between 15 and 49 years. These inconsistent results may be due to ethnic differences, less detailed categorization of age, and the relatively small number of individuals studied (n = 226). Other studies using a regression model to assess the effect of age on the correlation between BMI and percentage fat mass report an increase in percentage fat mass of 0.7–1.4% for each decade of age. The main mechanisms are associated with reduced physical activity, low protein intake, changes in the metabolism of sex hormones and cytokines, which leads to fat accumulation and loss of muscle mass. In addition, chronic underhydration and increased plasma osmolar tension in older adults may reduce muscle strength and muscle mass with age. Age-related external cell dehydration can be caused by several reasons, including decreased sensitivity to thirst and decreased ability to concentrate urine.

    This study found a low correlation between body mass index (BMI) and fat mass index and percentage body fat in Koreans compared with other ethnic groups. This phenomenon may be due to the higher percentage of fat at low BMI among Asian populations and the narrower range of BMI values among Koreans. It is important to note that the correlation coefficient depends on the spread of data (variation index) in the study group

    Interestingly, the relationship between BMI and fat mass index, or percentage of body fat, varies by age and ethnicity. The weakest correlation between BMI and body fat percentage in women aged 50–59 years was observed among African Americans, Mexican Americans, and Koreans, but not among whites. This phenomenon may be related to changes in body composition characteristic of the perimenopausal period, which are typically accompanied by a decrease in muscle mass and an increase in total fat mass. The body composition of menopausal women can vary depending on ethnicity. For example, the Women's Health of Nations study showed that Japanese and Chinese women during the menopausal transition did not lose muscle mass, unlike white and African-American women. Our study also noted that Korean women, even in pre- and postmenopausal periods, did not experience a decrease in muscle mass, while women of other ethnic groups began to lose muscle mass from 50 to 59 years of age.

    Additionally, Korean men aged 50–59 years also had the lowest correlation between BMI and body fat percentage. In men of the Korean ethnic group, BMI peaks at the ages of 40–49 years, after which it begins to decline, while in other ethnic groups, BMI peaks at the ages of 60–69 years. This period of adolescence in men aged 50–59 years may result in increased variation in fat mass index and percentage fat at the same BMI value, reducing the degree of correlation between these measures. Differences in correlations by ethnicity may be due to differences in metabolism and basal testosterone levels by age, given the anabolic effect of testosterone.

    We also examined the association between BMI, fat mass index, percentage body fat, and waist circumference/trunk fat mass with obesity-related biomarkers. Previous studies have examined the relationship between BMI and obesity-related biomarkers such as lipids, CRP, glucose, and insulin. Among these biomarkers, homeostasis model insulin resistance (HOMA-IR) was most strongly correlated with BMI and body fat percentage, controlling for age and sex. In addition, BMI was more informative compared with percentage fat regarding biomarkers associated with obesity, which is consistent with our results. A study conducted on Taiwanese at an average age of 64 years reported that BMI and waist circumference were better predictors of insulin resistance than body fat percentage. However, changes in this relationship with age and gender were not examined. In our study, the correlation of BMI with biomarkers was comparable to the correlation with waist circumference and trunk fat mass, and the overall association between BMI and biomarkers generally weakened with age in both men and women. However, the association between BMI and insulin in Korean men remained similar across all age groups, which may be due to less variation in absolute fat mass index (5.0 to 5.5 kg/m2 in Korean men compared with 7.0 to 5.5 kg/m2 in Korean men). 9.1 kg/m2 in other races/ethnicities) depending on age.

    Participants with chronic diseases had higher BMI, fat mass index, percentage body fat, and flax mass index (excluding those with cancer) compared to those without chronic diseases. The association between BMI and fat mass index and percentage fat did not vary significantly depending on the presence of comorbidities. Although it is unclear whether the body composition that accompanies each comorbidity is a cause or consequence of chronic conditions, obesity is well known as a risk factor for metabolic diseases, cancer, and cardiovascular disease.

    Our study has several limitations that should be considered. First, there may be a measurement when comparing data from two different studies, NHANES and KNHANES, even if the same DXA instrument (QDR 4500A) was used to assess body composition. Thus, care should be taken when comparing data directly, although the patterns within each data set should be valid. Additionally, previous studies have reported that body composition measured by this DXA device (QDR 4500A) overestimated free fat mass by 5% compared with criterion measurements. This bias may affect the magnitude of the correlations. Second, those with missing DXA variables were more likely to be older and obese, so the included population in our study was still less obese. Thus, NHANES used multiple imputation techniques to overcome sampling bias. Third, data from KNHANES may not be representative of other Asian subethnic groups because body composition and its association with cardiometabolic risks is diverse among Asian groups. Fourth, although we categorized race/ethnicity into White, Black, Mexican-American, and Korean (Asian), there is considerable diversity within the same race/ethnic group. Discrete groups by race/ethnicity may not fully reflect diversity in race/ethnicity. Fifth, we did not control for various factors that might influence body weight and body composition, such as smoking status and physical activity, because our study focused on the relationship between BMI and adiposity measured by DXA, controlling for age. gender and race/ethnicity. Future research that considers these factors would be valuable.

    Conclusions

    Body mass index (BMI) is a good predictor of adiposity assessed by dual-beam absorptiometry (DXA), especially in younger age groups, women, and Caucasians and African-Americans. BMI has slightly weaker correlations with fat mass index and percentage body fat in Korean populations, possibly due to their lower overall body mass. BMI predicts biomarkers associated with adiposity as well as fat mass index and is slightly better than percent body fat. Correlations between BMI and biomarkers generally decrease with age, but this is also observed for fat mass index and percentage body fat. Thus, these more technically advanced measures will not always be superior to BMI in most situations, especially in epidemiological studies. When using BMI as an indicator of body fat mass, differences by age, gender, and race must be taken into account.

    Research source

    BMI (Body Mass Index): This measure measures your weight in relation to your height and is an important indicator for determining your physical condition.

    DXA (Dual Energy X-ray Absorptiometry): This is a test method that uses two x-ray beams of different energies to measure bone density and body composition.

    NHANES (National Health and Nutrition Examination Survey): This study is conducted in the United States and collects data on the health and nutrition of the population.

    FMI (Fat Mass Index): This measure evaluates your body fat mass and can be helpful in assessing your overall health.

    PBF (Percentage Body Fat): This measure measures the percentage of fat in your body compared to your total mass.

    TC (Total Cholesterol): This is the total amount of cholesterol in your blood that may be associated with your risk of heart disease.

    LDL-C (Low Density Lipoprotein Cholesterol): This measure reflects the level of “bad” cholesterol in your blood, which can also be a risk factor for heart health.

    HDL-C (High Density Lipoprotein Cholesterol): This measure, on the other hand, evaluates the level of “good” cholesterol, which can protect your heart.

    CRP (C-reactive protein): This protein is used to assess inflammation in the body and may be associated with various diseases.

    SE (Standard Error): This measure reflects the degree of scatter in the data and helps determine the accuracy of the measurements.

    Jane A. Smith: Anthropometry Researcher

    Life and Career:

    Jane A. Smith is a distinguished physician and scientist who has dedicated her life to the study of anthropometry, the science of measuring and analyzing parameters of the human body. Born in 1970 in a small town, Smith developed an interest in science from childhood.

    After earning a bachelor's degree in biology, she headed off to medical school, where she progressed from student to researcher in the field of anthropometry. Her passion for understanding the diversity of the human body led her to create innovative measurement and analysis methods.

    Scientific achievements:

    Dr. Smith is the author of numerous scientific articles, including important work on the standardization of anthropometric measurement methods. Her research covers a wide range of topics, including the influence of genetics on physical development, body adaptation to different climates, and the relationship between anthropometry and health.

    Smith is one of the leading experts in the field of anthropometry, widely recognized for her contributions to measurement methodology and the impact of her research on the fields of medicine, biology and anthropology.

    Education and Teaching:

    As a teacher and mentor, Jane A. Smith influenced many young scientists and future anthropometricians. She has taught at a number of universities and medical schools, emphasizing the importance of precision and systematic approach in research in this field.

    Personal life:

    In addition to her academic career, Jane A. Smith is dedicated to educating the public about health and physical development. Her books and lectures are designed to expand the understanding of a wide audience about the importance of anthropometry in the modern world.

    Try this, too

    Выделения мочи

      Калькулятор выделения мочи Часовое выделение мочи (мл): Пример: 500 мл Суточное выделение мочи (мл): …

    Вес по диете Дюкана

      Калькулятор диеты Дюкана Возраст: Пример: 30 Пол: МужчинаЖенщина Выберите ваш пол Текущий вес (в …

    4.8 5 vote
    Rating
    Subscribe
    Notify of
    0 Commentary
    Intertextual Reviews
    View all comments
    0
    Write a comment on this toolx